AOI Composer

July 4, 2026

Loading code snippet...

I've been working a decent amount with AOI camera measurements and have been working on some ways to visualize and debug a manufacturing line given those measurements. I was using some minitab to do some statistics but it did not handle the amount of data quickly and formatting to be in the right shape for what minitab wanted was a bit of a chore. So I've been using a bit of python.

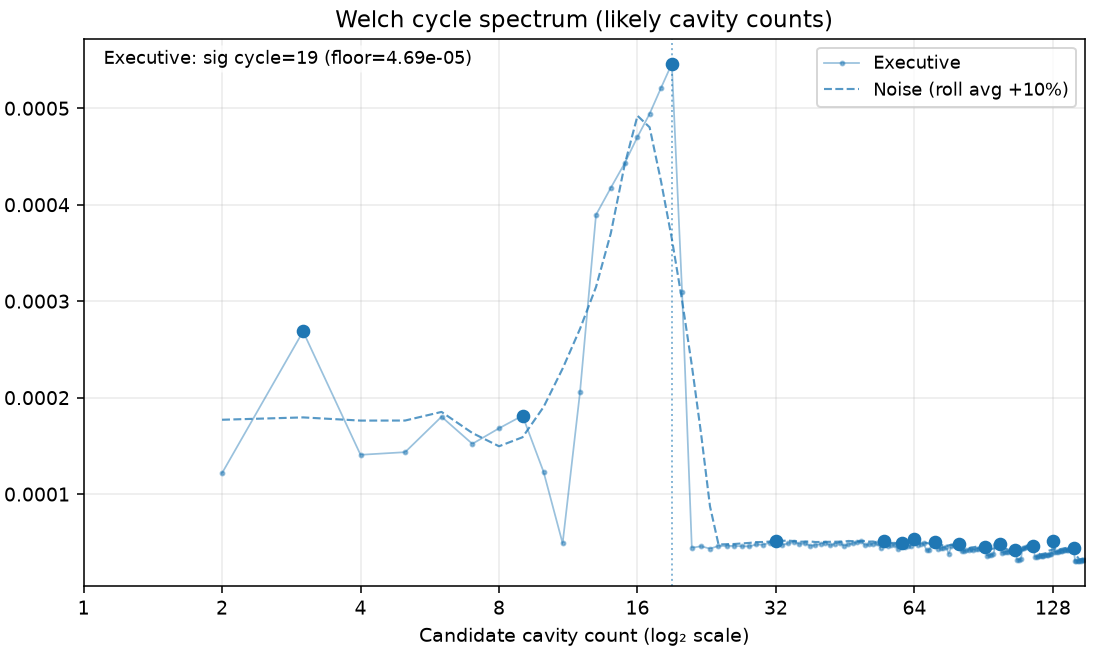
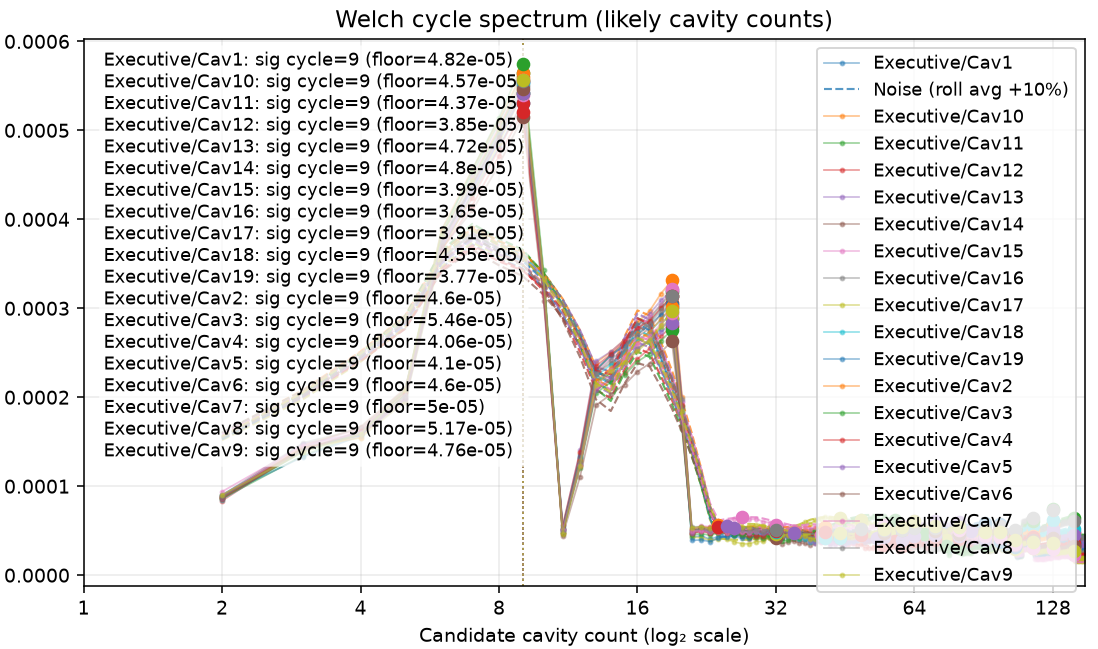
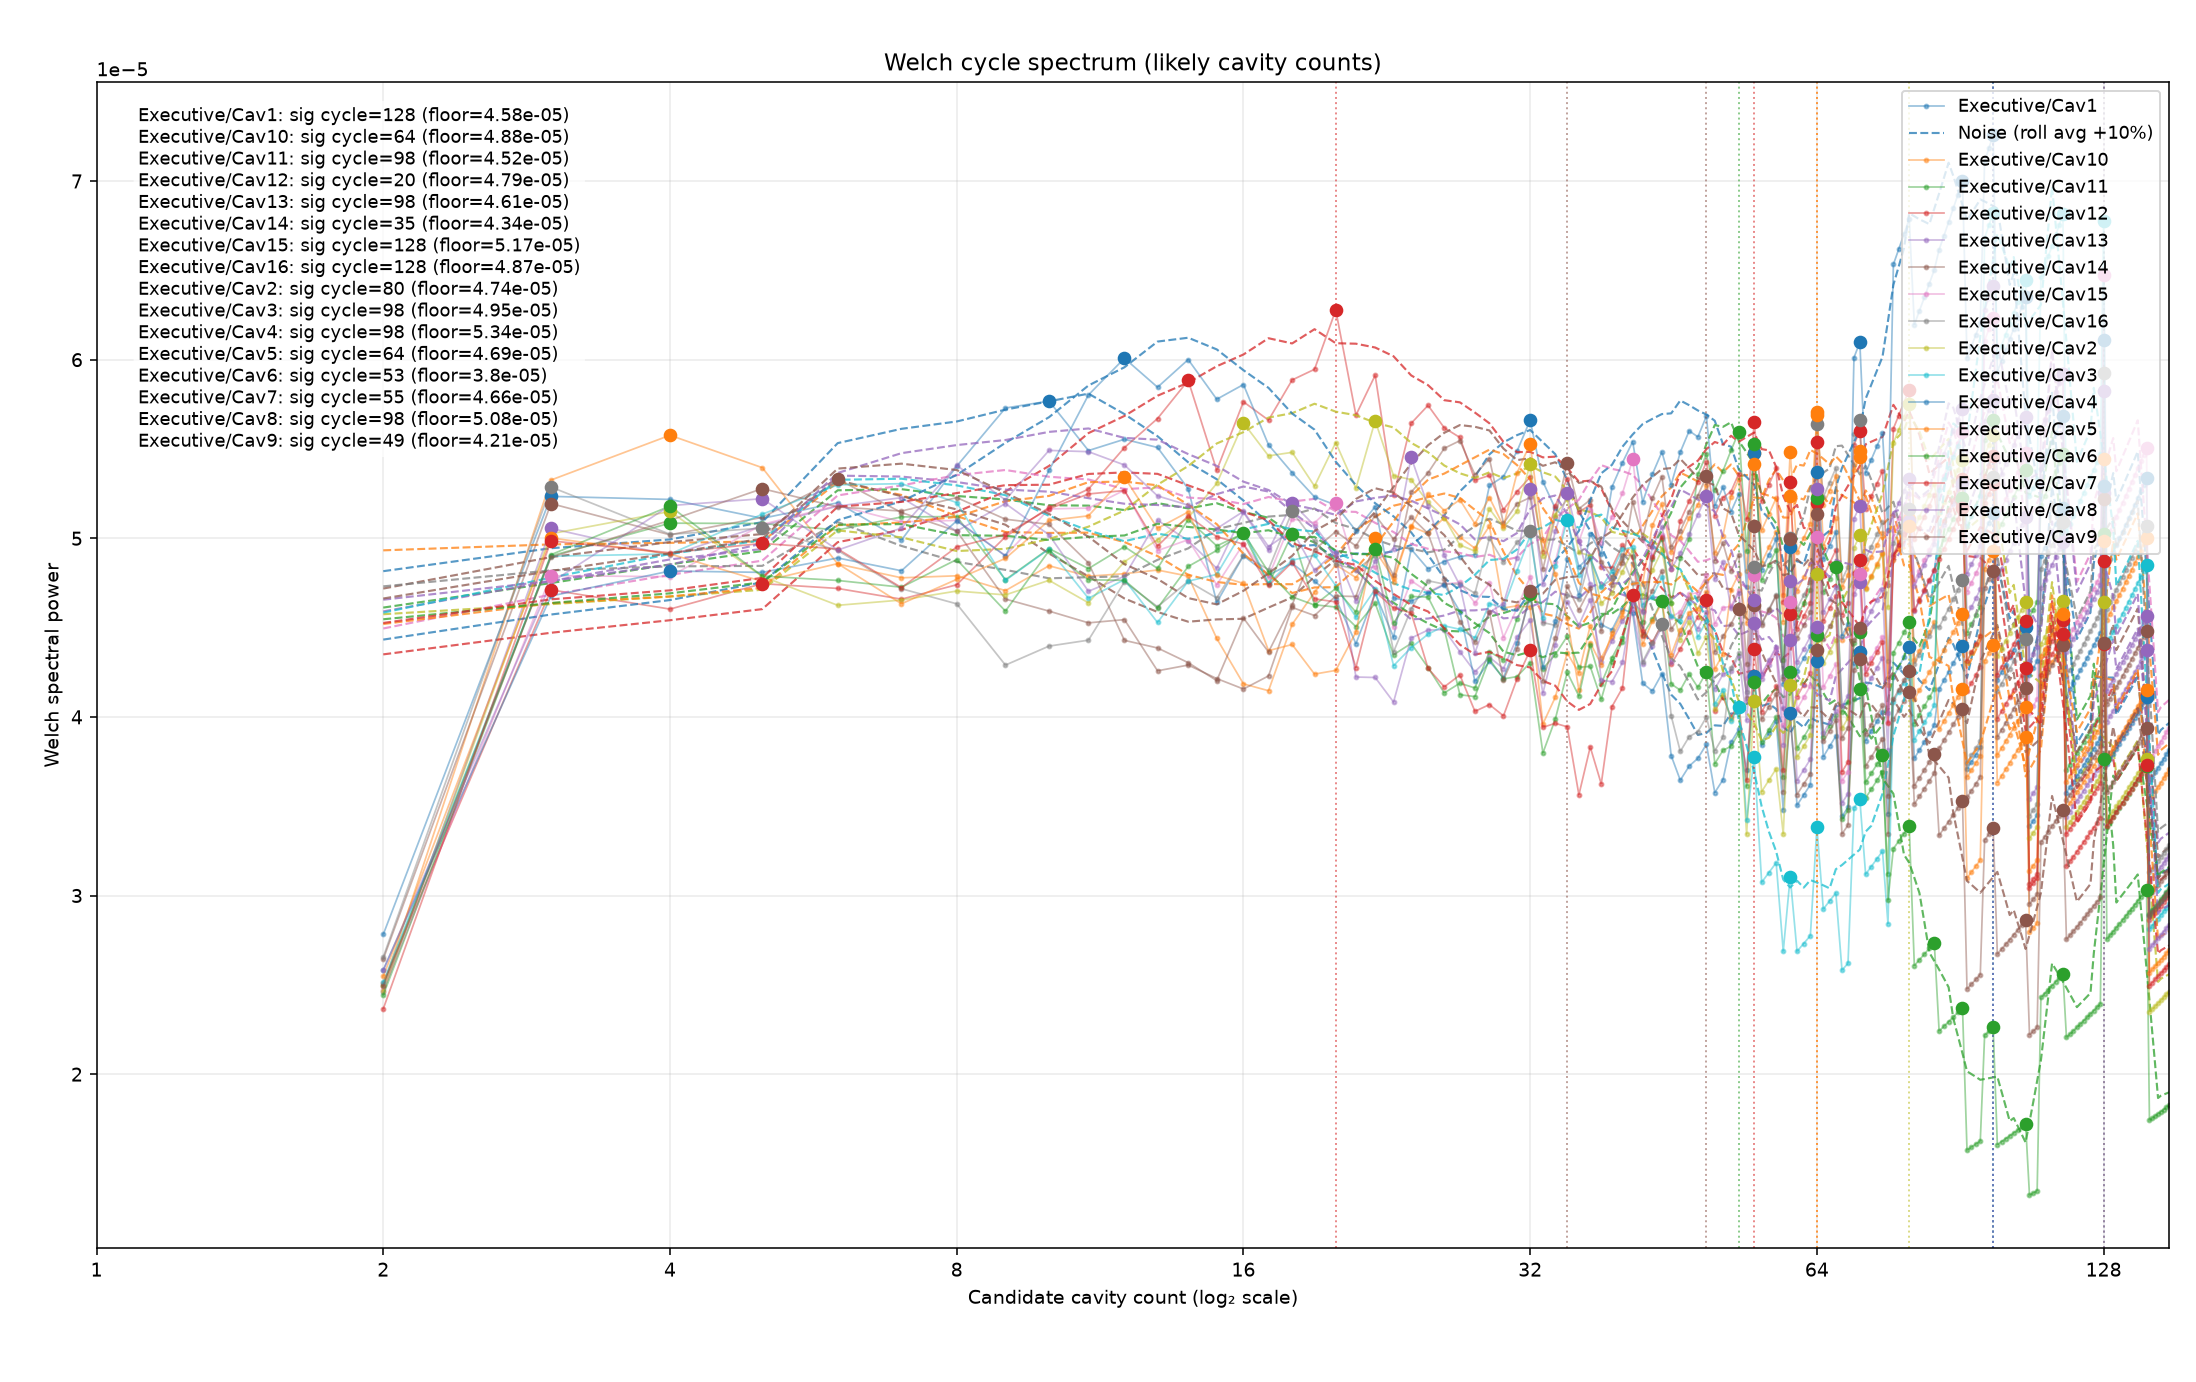
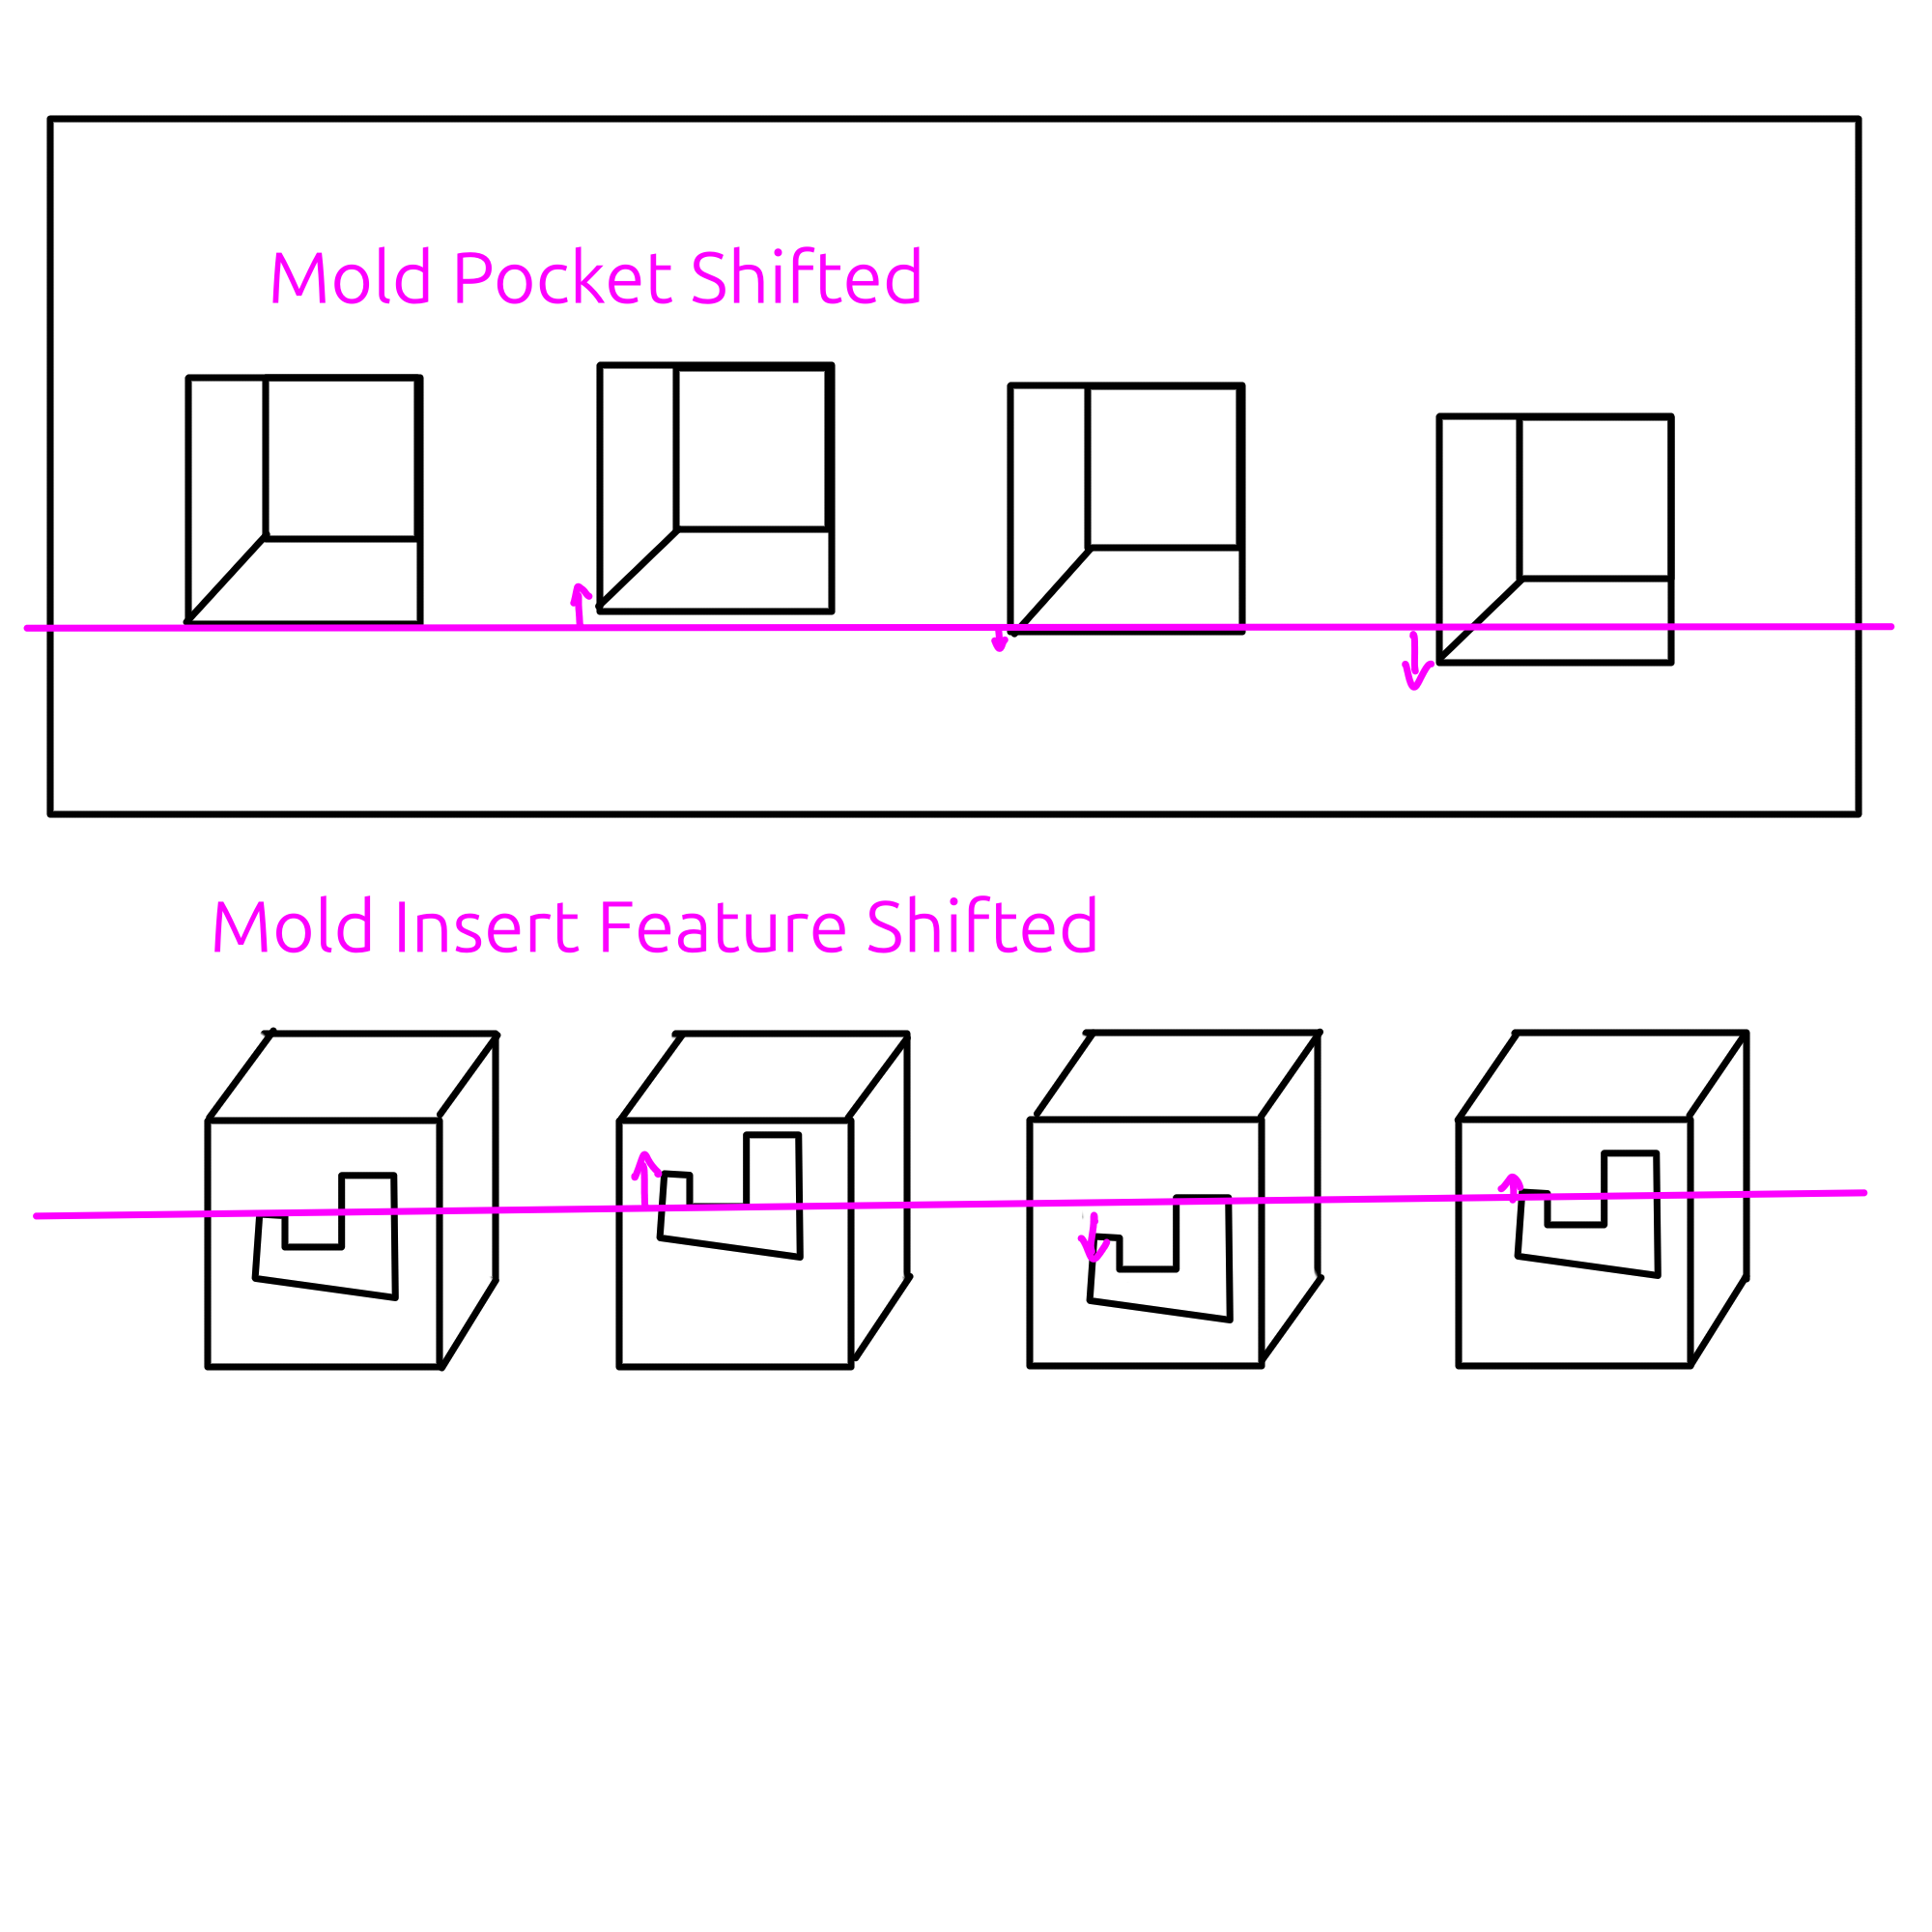
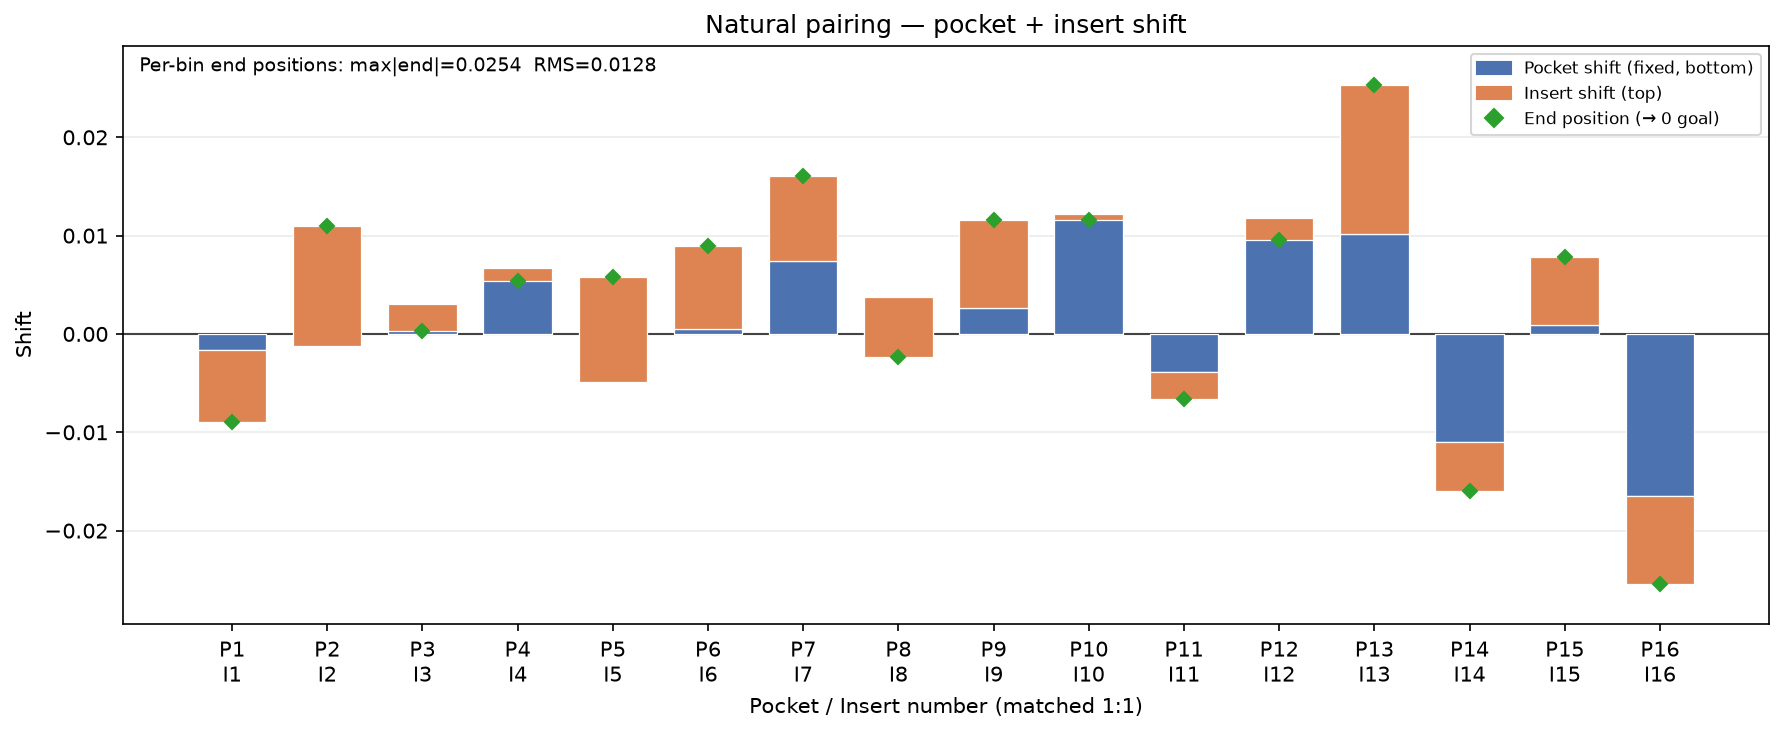
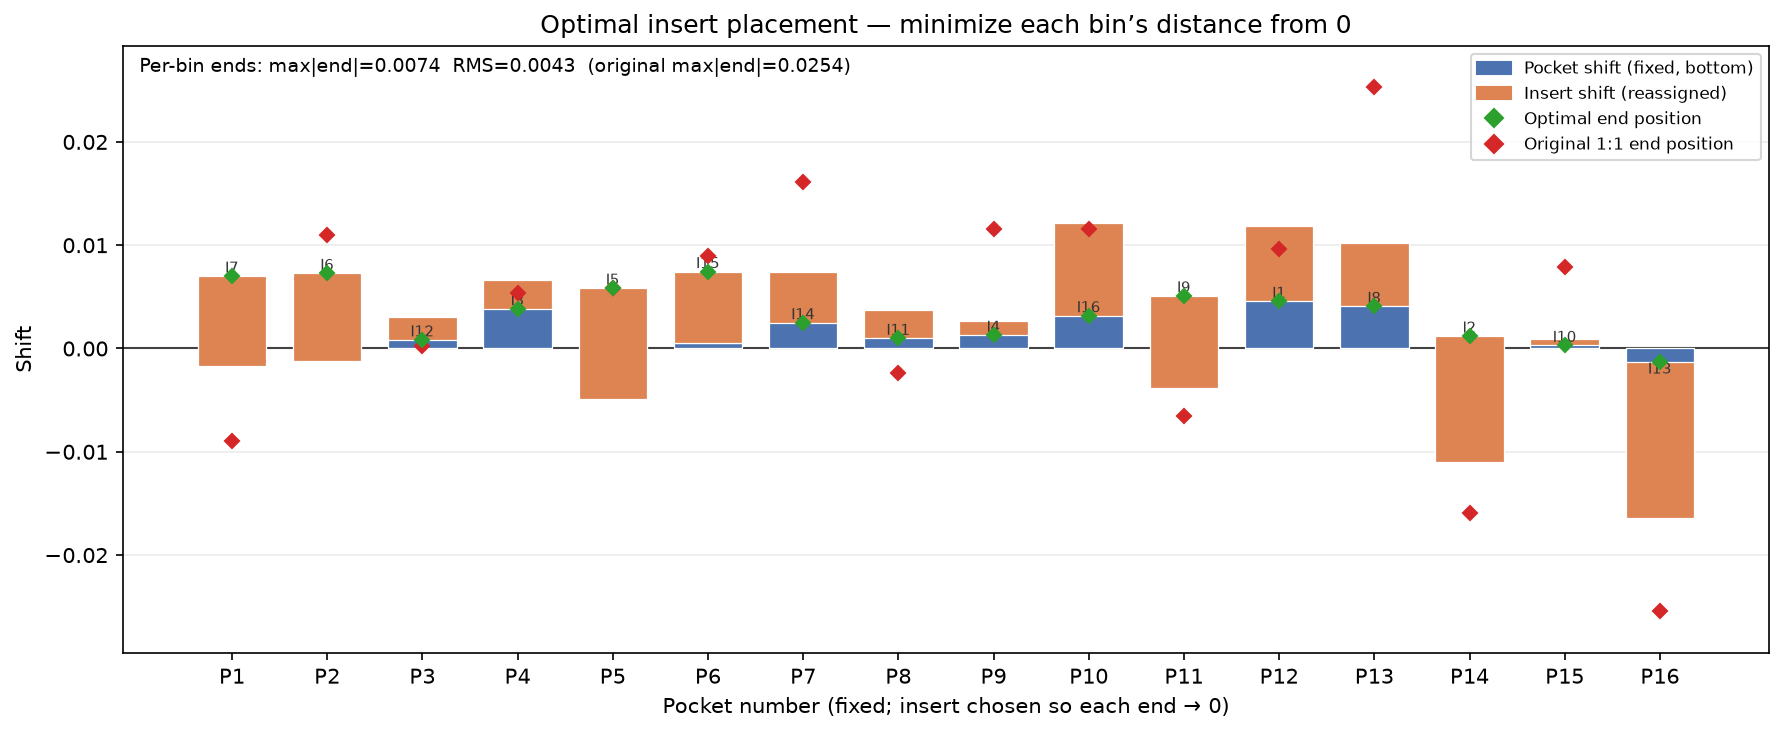
I work with a lot of stamped and overmolded components. For stamped components it is normally fast enough that there is only one cavity. But for molding operations, to keep up with other processes, the mold runs multiple cavities normally 8 or 16 or some exponential of 2.

Anyway here is the setup:

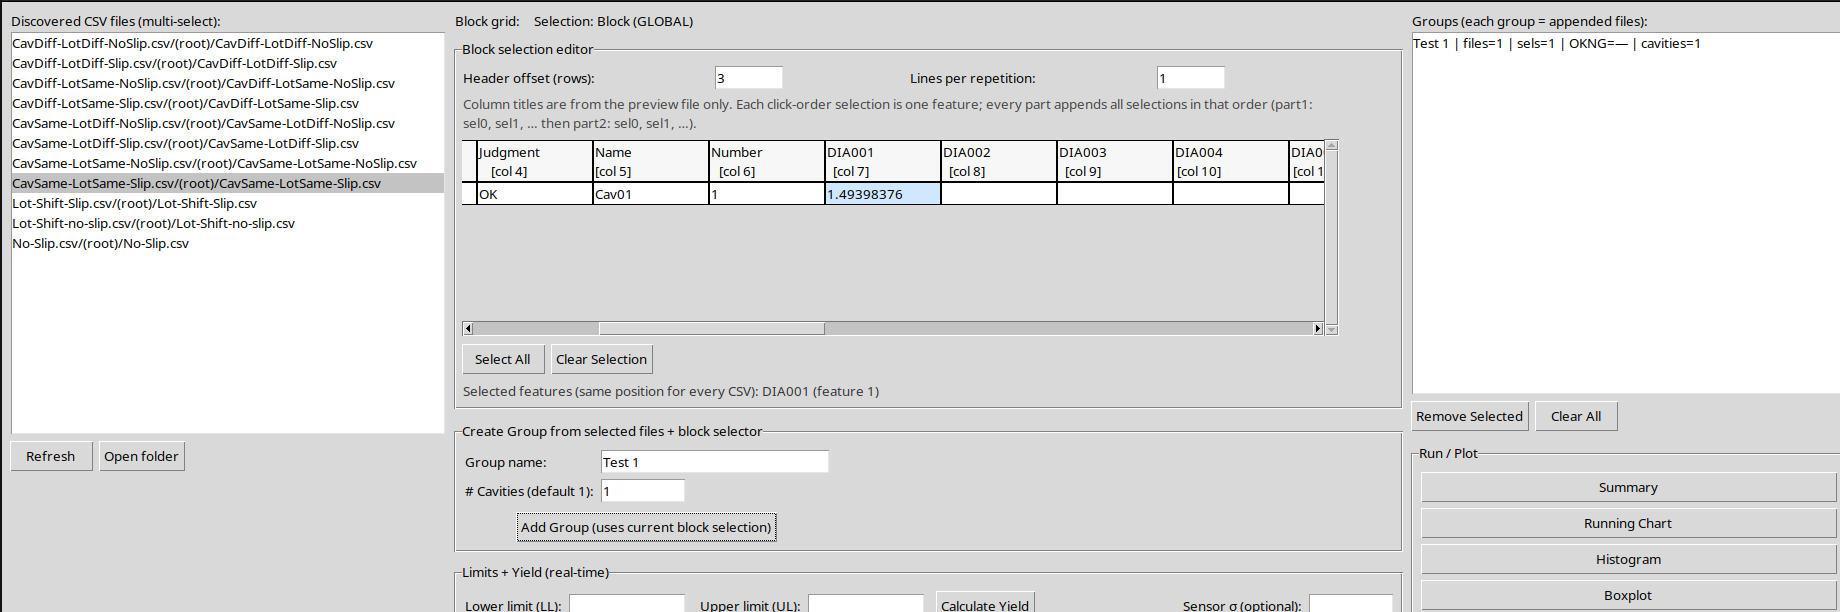
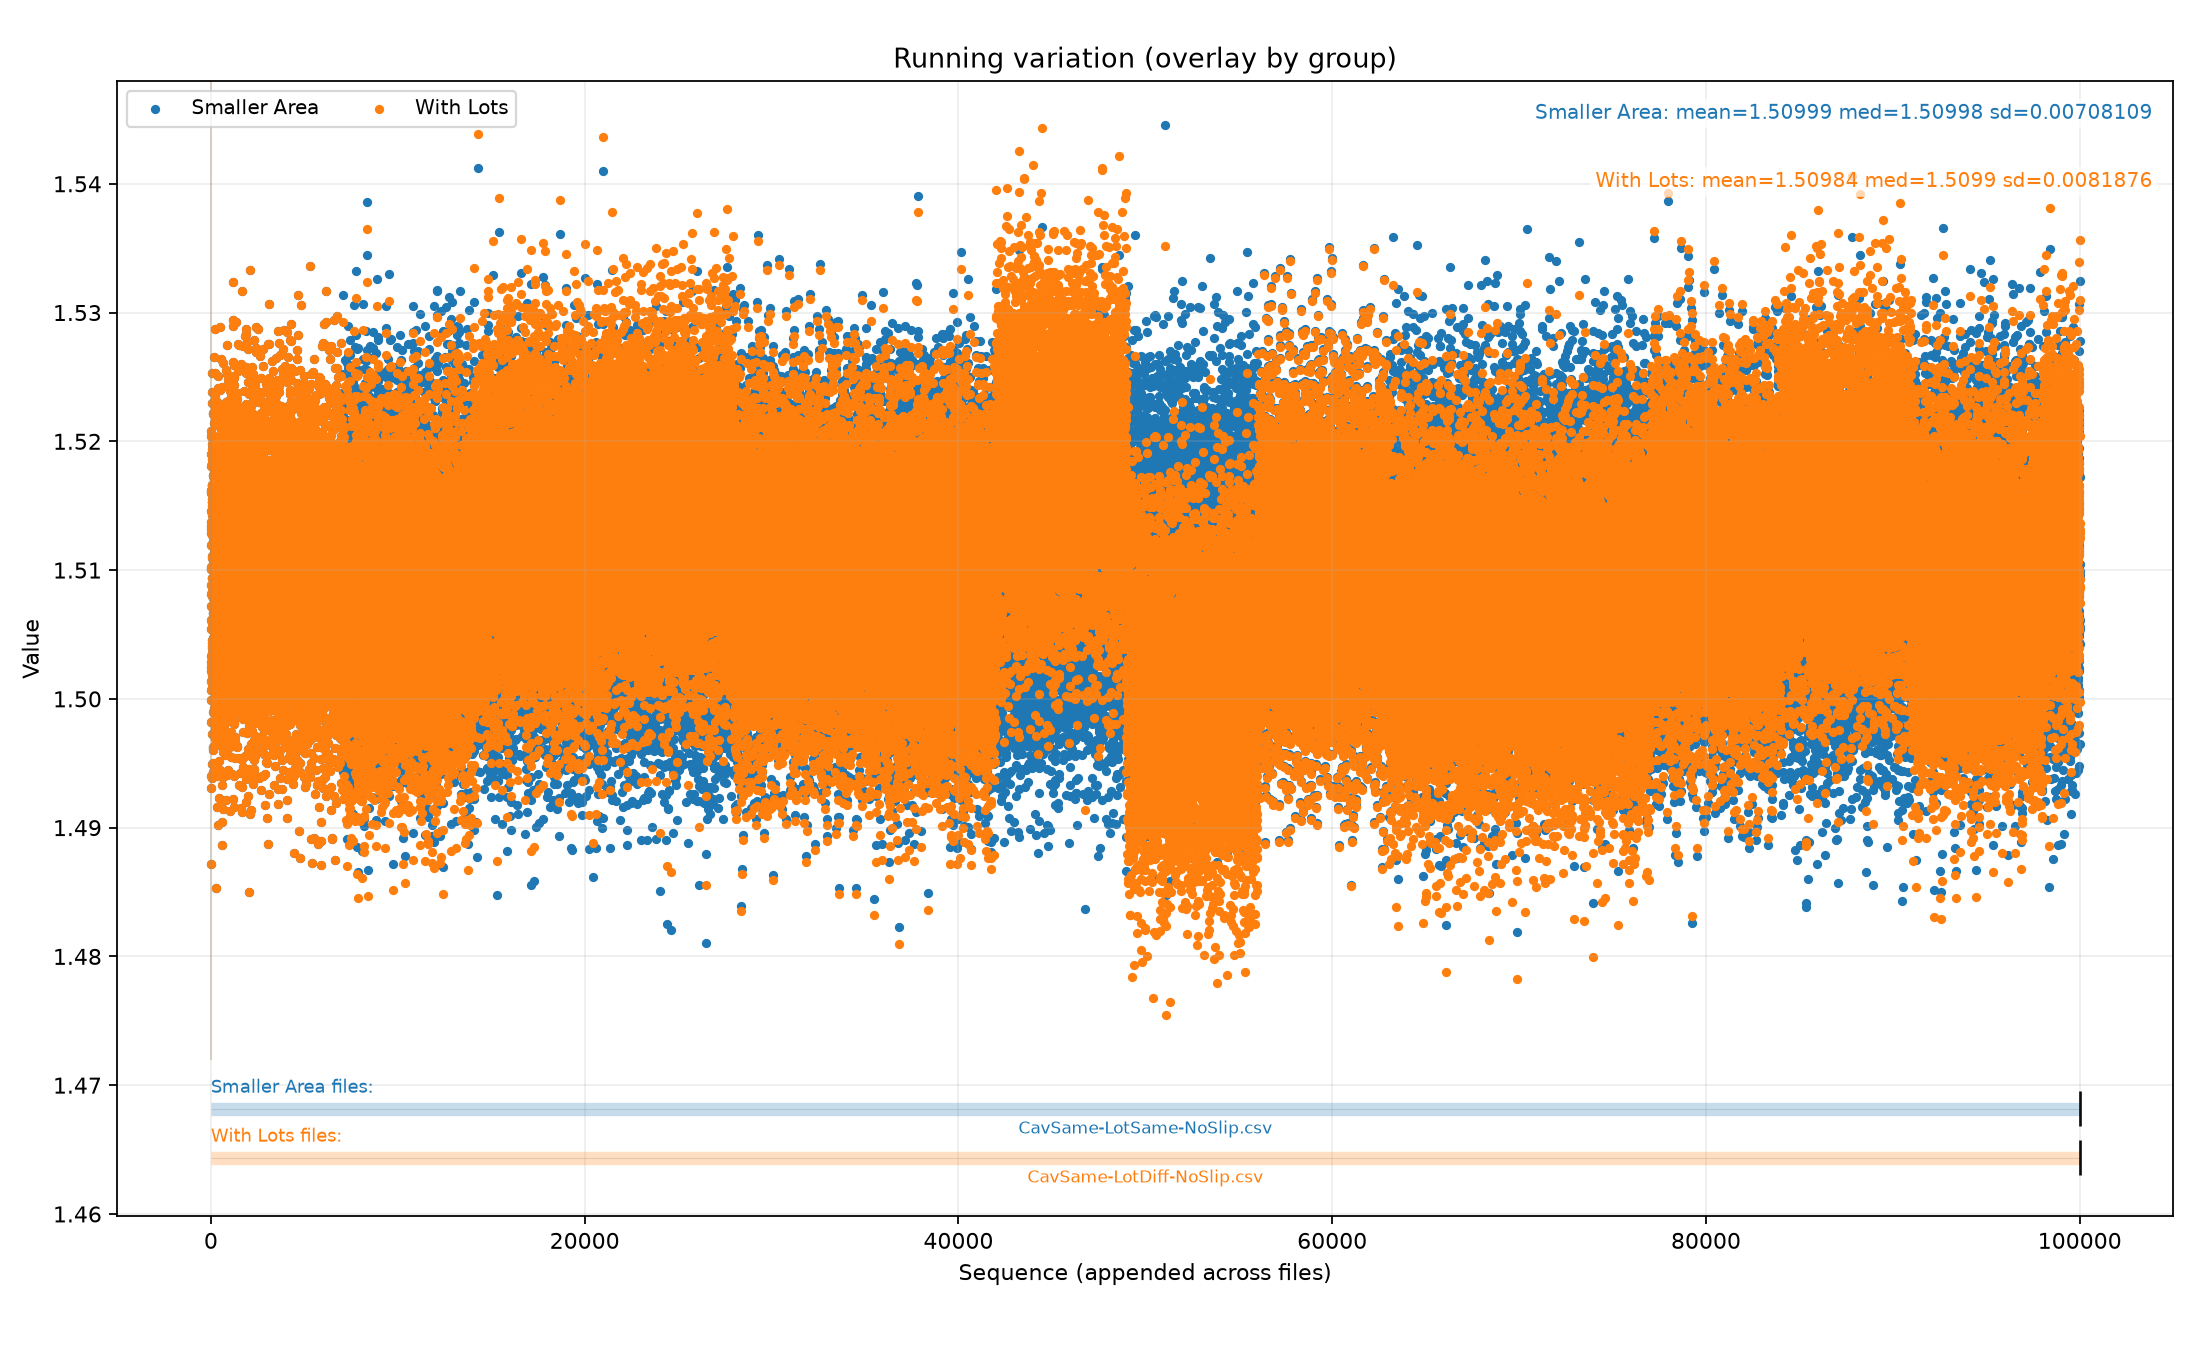
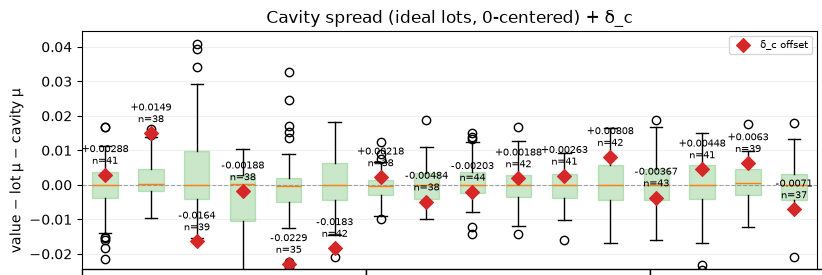
I am given this CSV data, I have a few critical features I need to bring into tighter control:
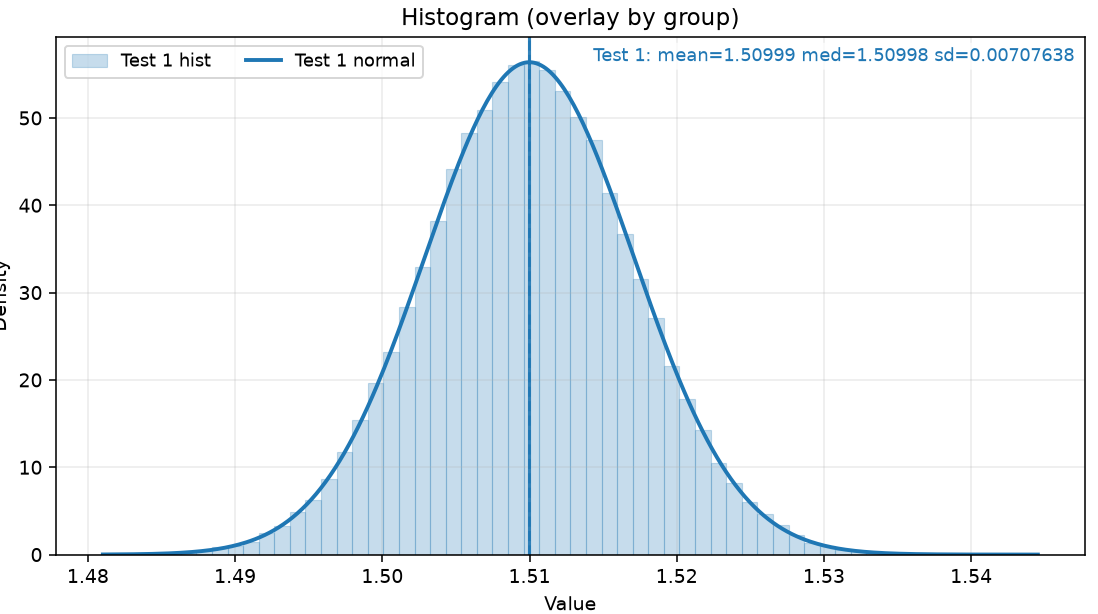
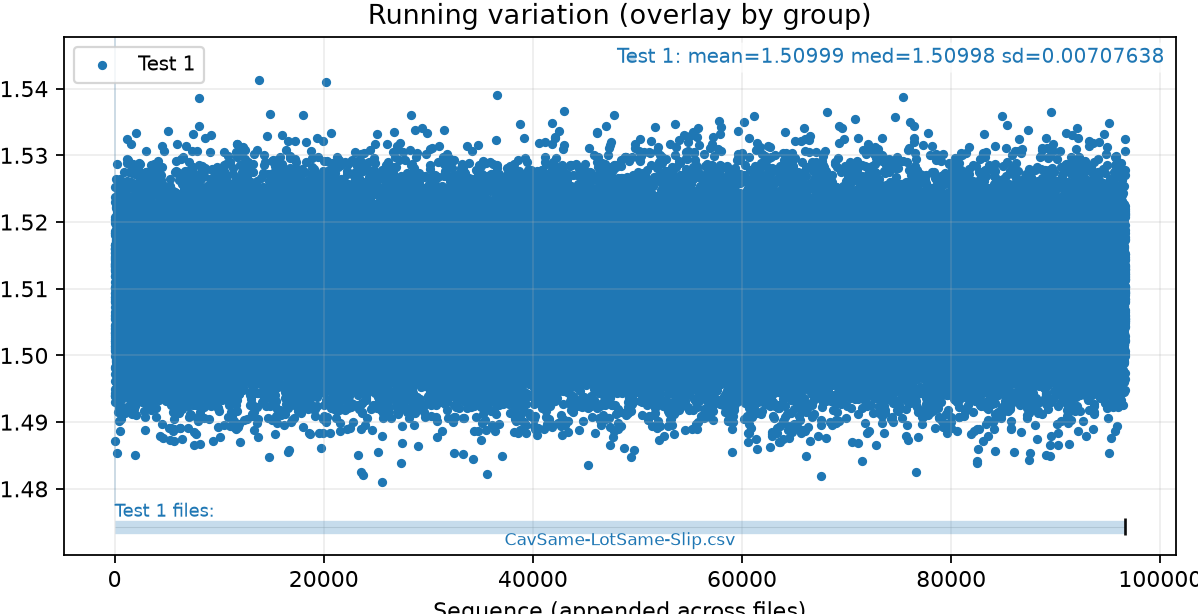
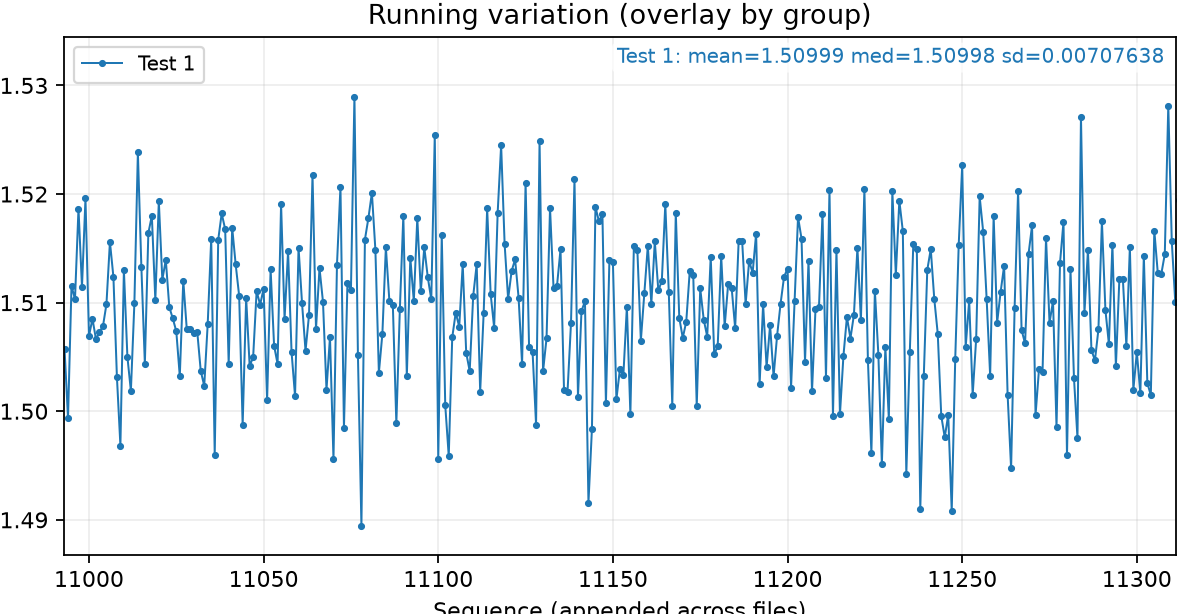
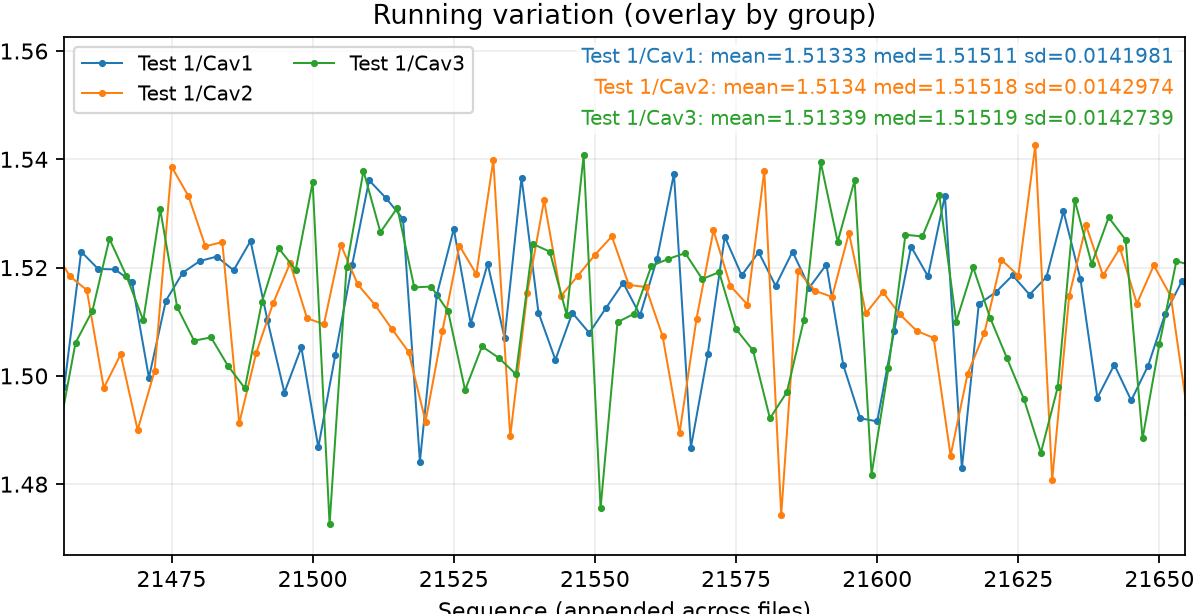
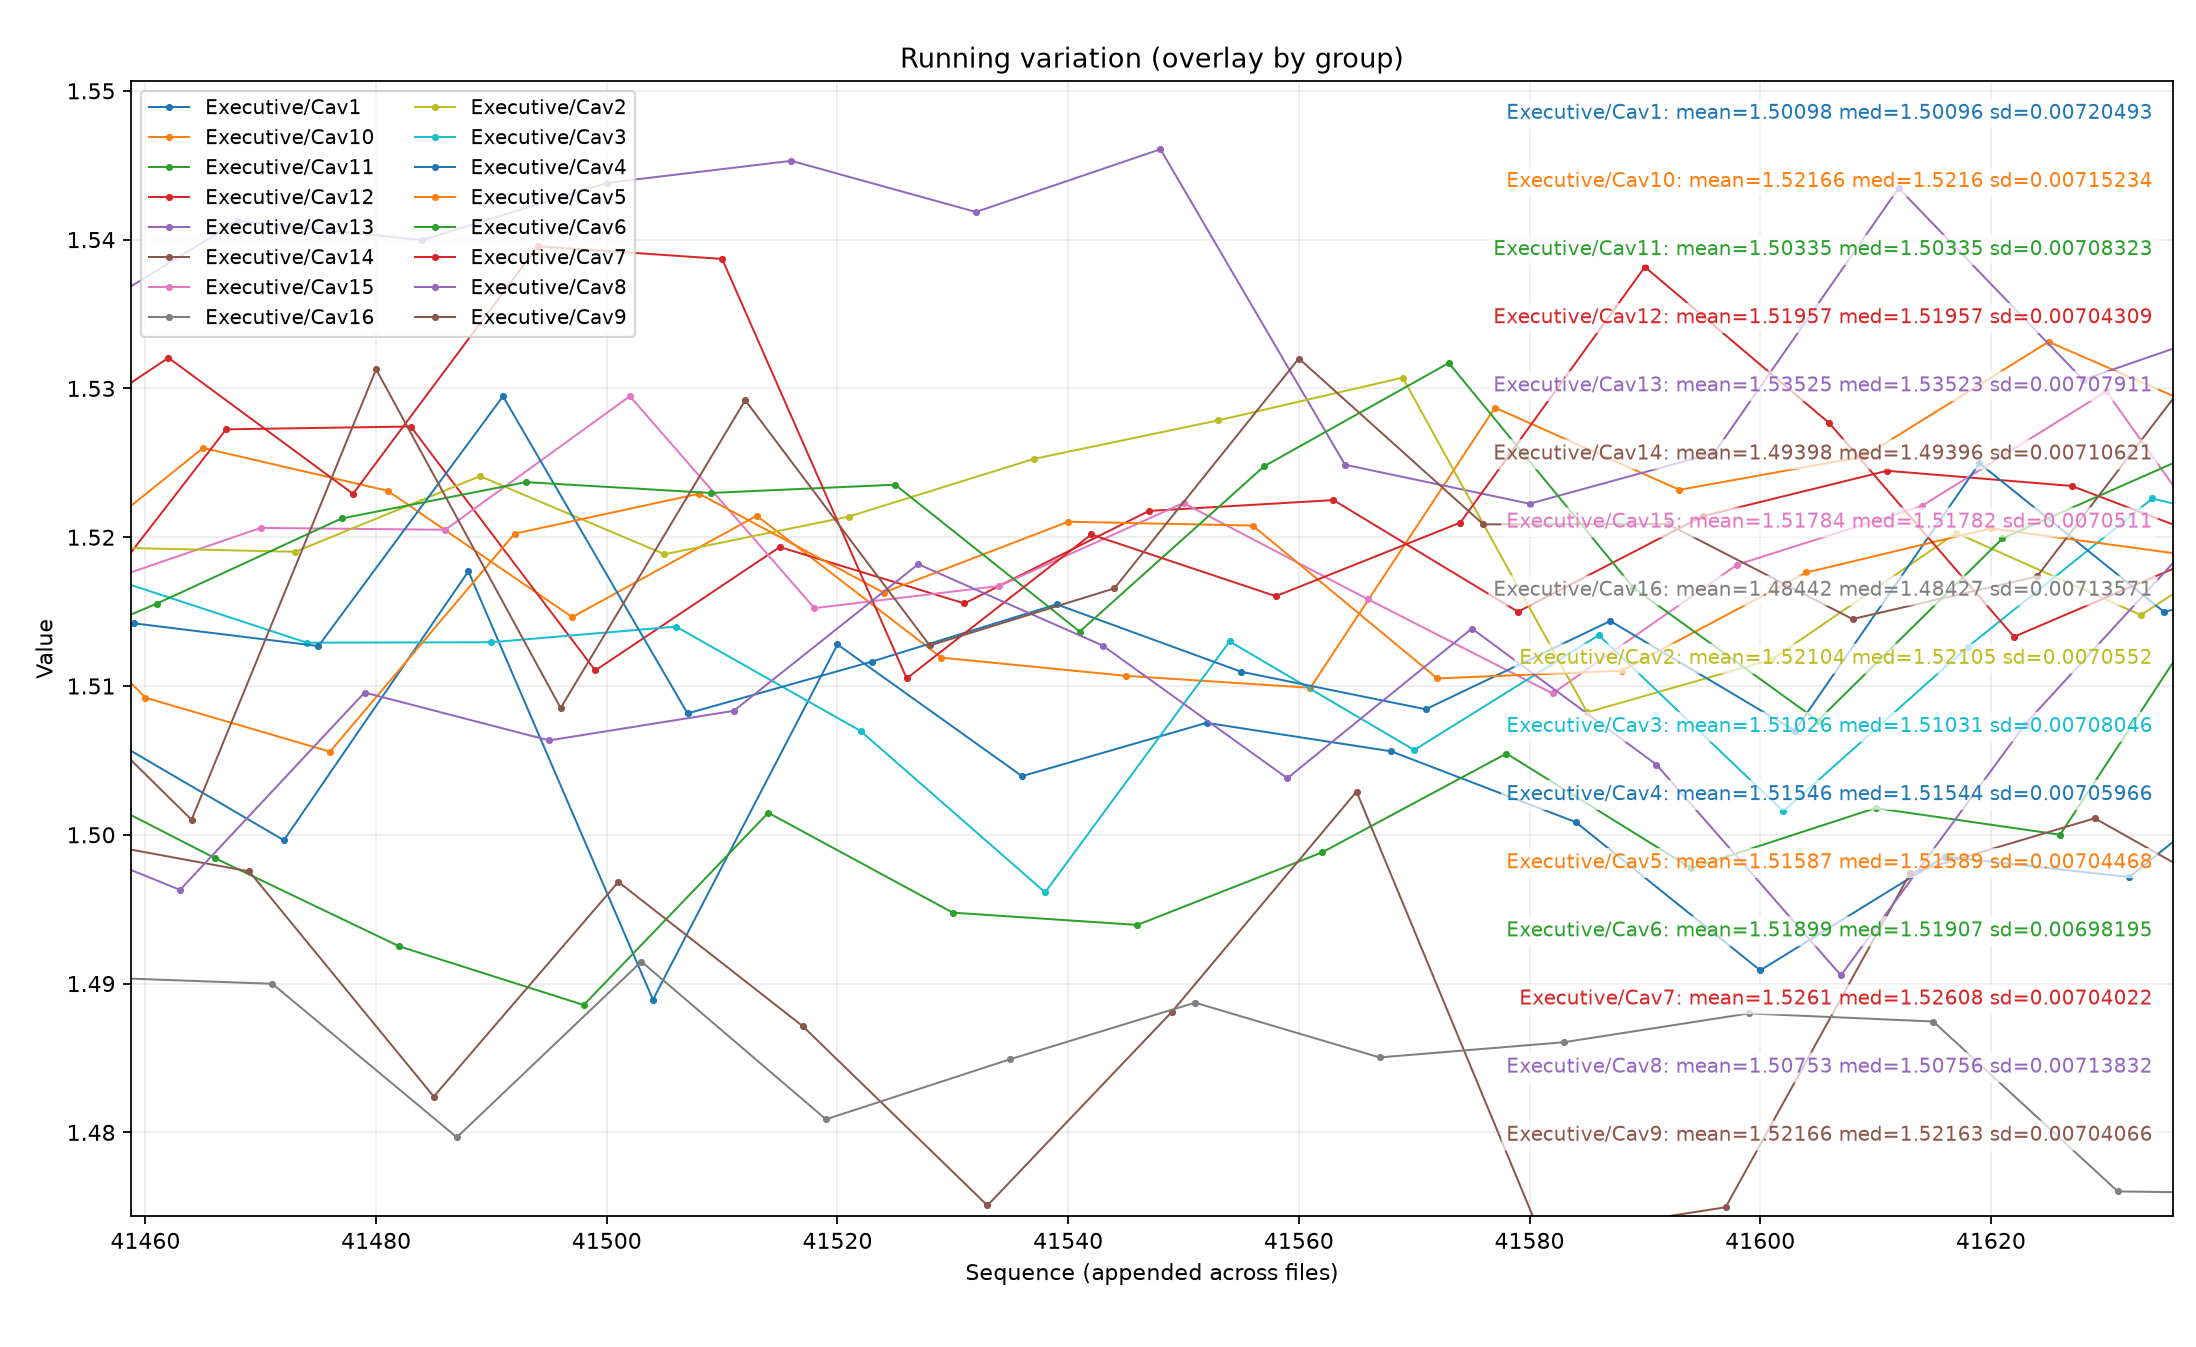
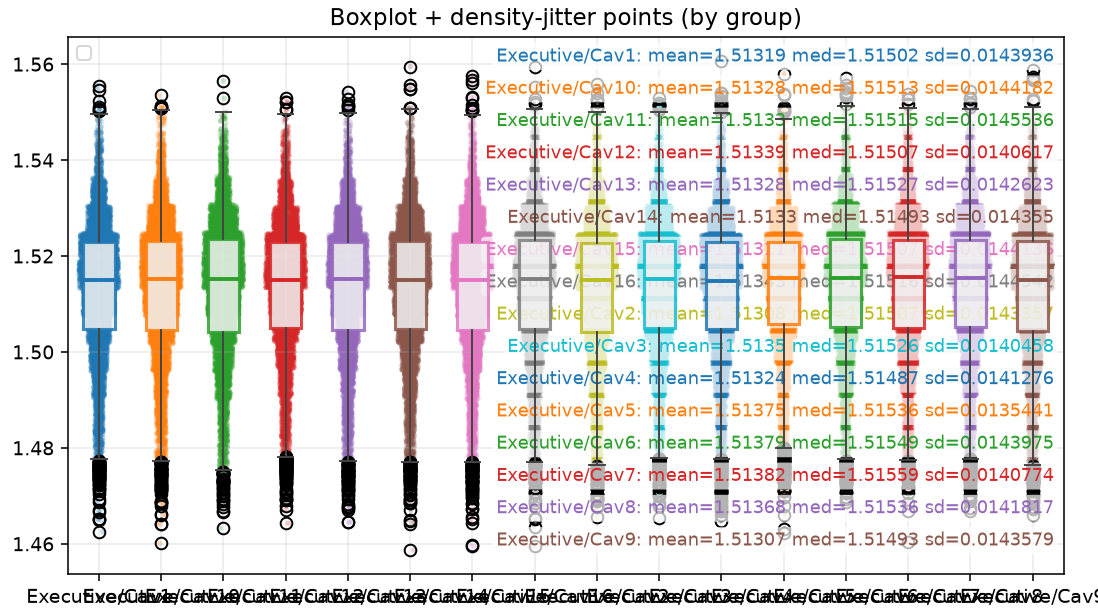
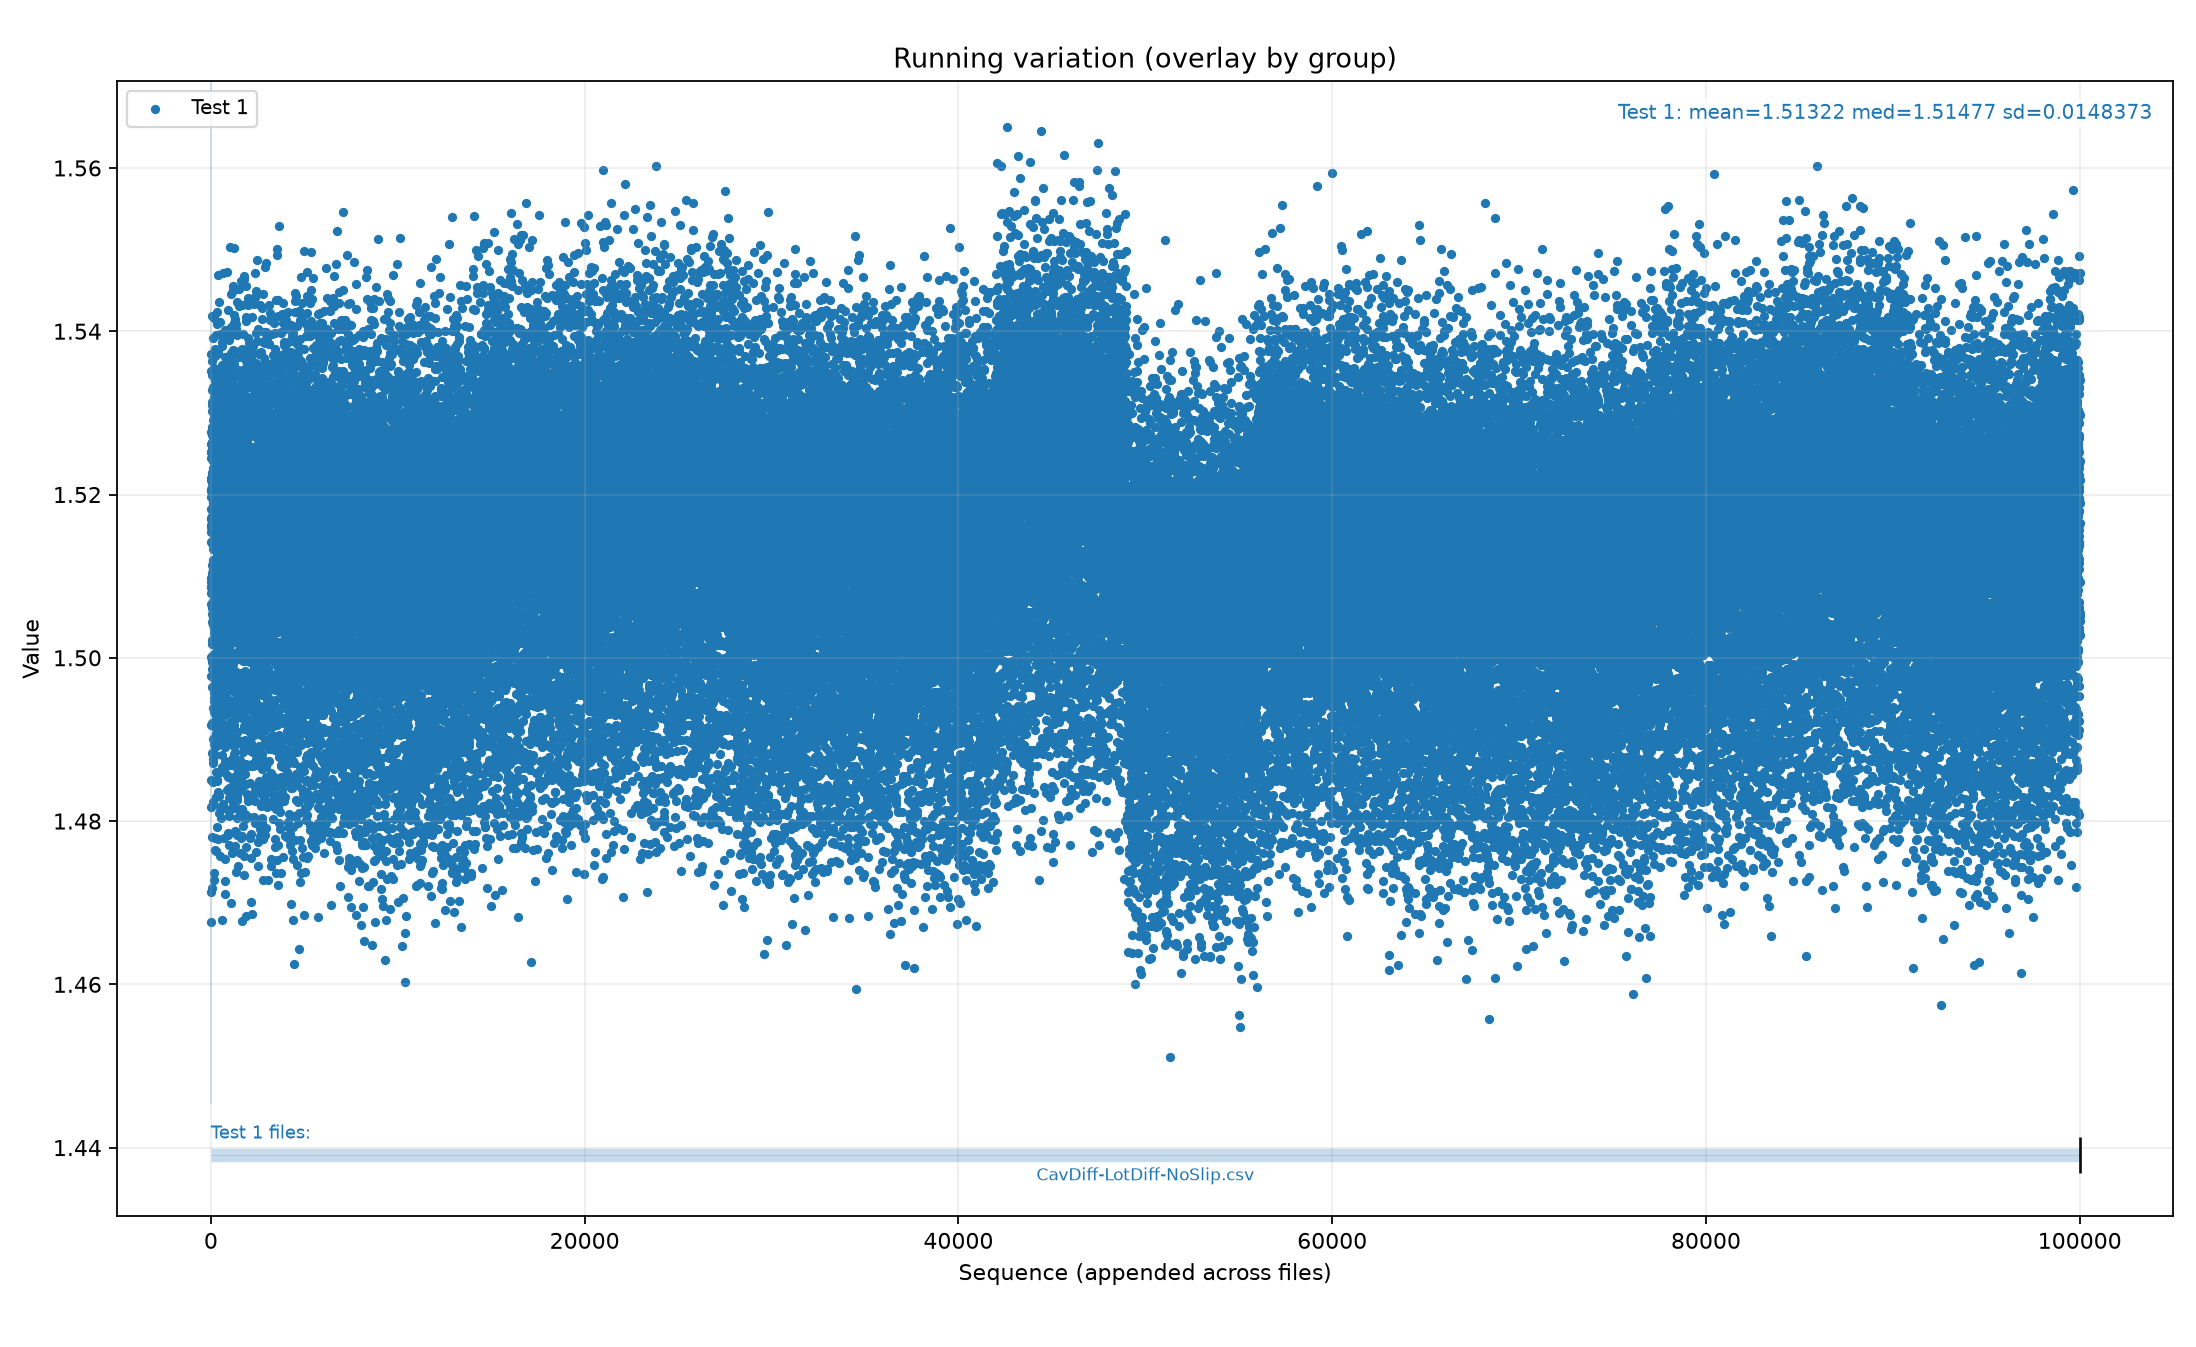
Loading code snippet...

First off I just created script to select the measurements and then iterate through and show the normal statistics: median value, standard distribution, and running chart to see how measures change over time.

So here's what that looks like:

Image
Image
Image

Running Charts

You might notice this is over a few tens of thousands of measurements this is over a day or two of output. Zooming into the running chart I noticed something interesting:

Image

You might convince yourself this section is slightly cyclical but counting it is really hard. So I added a naive cavity number assignment (assigning 3 in this case) that then those cavities get connected on the running chart.

Image
Image

Hey, that works but I need to iterate through a few cavity numbers to find one that fits nicely. I find that the cavity number is 16 and then plug that in. what does the standard distribution of each cavity looks like:

Shown is are the boxplots of each cavity given the above method. That doesn't look good, everything looks the same... what's happening? Slip, in a previous process a machine punching out some of the components because they measured as out of spec.

This shifts the naive cavity assignment method so that it is misclassifying the data. So, as it goes along classifying more and more of the data the real cavity and the reported cavity get more missaligned. This ends up smearing out the data into all the bins so that everything looks the same.

I'm going to deal with these slip events later but lets look at finding the cavities cycle numbers a bit easier.

Finding what the number of cavities is is kind of manual and a pain. I don't always know what the real cavity number is or it might be pointing to underlying components vs some smaller cavity process

Image

FFT Cavity Detection

This is cyclical data which means it has a frequency and random noise is relatively infrequent and the noise doesn't have a characteristic frequency (random). So what if I take the FFT (Fast Fourier Transform) so I look directly at the frequency space instead of the time series. As a benefit, random occurrences or infrequent shifts would only show up as extremely high frequency noise compared to the cavity numbers I want to look at (<128 cavities).

As a reference, the data I work with tends to come in exponents of 2 (molding): 2, 4, 8, 16...

Image

WOW, that's nice, you might notice the reported peak is not at a power of 2 it is at 19, this is due to spectral leakage. Spectral leakage occurs because of the binning that I am doing to perform the FFT over the dataset. If I put that 19 value into the cavity number and rerun the FFT I see that it does not remove the data peak:

Image

However if I clamp the frequency to a power of 2 and input 16 as the cavity and rerun the FFT:

You can see that the peak is no longer there, there are some weird one off peaks dotted around. This more or less says that the cycle was removed by splitting into cycles of 16.
That's really powerful! (there is some high frequency noise as it gets to higher cavity counts due to the way that I bin the data again) I can now find repetitions in data easily that correlate to processes differences.

Image

Why FFT Works

But again why does this work? Ok, I bypassed the slips in the data that were messing up some stuff... those are completely random and far apart so that makes sense for it not to show up but there is still underlying variation from the process that will never be perfectly aligned in a nice sine wave. When I look at each cavity I get in-cavity variation every time that missaligns the data? Yes, but I am relying on a good non-biased statistical process: The variations from each run will be equally distributed above and below the median, and the magnitude and polarity of that shift will be random. so again that random data gets filtered out. At worst it shows up as extremely high frequency noise. It won't show up in portion of the FFT I care about!

On average these small shifts are equally distributed above and below with no pattern. So it doesn't show up in the FFT. Very nice.

So I can get the number of cavities from the process, assuming there is no underlying cycle in the incoming material (in overmolding incoming parts can have their own cycle that needs seperated out). I know the cycle but now I need to correlate it to the measurement data (kinda).

Image

Those slip events are still ruining a naive cavity assignment across the larger dataset... I'll throw in another wrench in the works to make it harder now. Heck, I'll throw two in there to try to gum things up real good.

Lot-to-Lot variation and randomly interspersed extreme outlier data. Outlier data, not a big deal it get sorted out from FFT data same as everything else. But it is messing with cavity means. Lets wait on that. Lot-to-lot shifts are shifts in the overall mean over an entire lot of data, this is from factors like taking tooling down and then putting it up again causing a slight shift. Or from using a different set of material: in stamping that is putting in a new reel, in molding this might be a new bag of plastic. I am looking at the number of parts in a "Lot" (AKA a stamping reel) that is about 7000-10000. So I expect to see a large number of lot shifts in the data 8-15 per dataset roughly every 7000 parts.

Image

Lot Variation Isolation

These are real and good to understand as incoming good variation but I want to isolate that variation from the variation of the cavitis. In a really good manufacturing process these lot to lot shifts would (not be there) be nice clean sharp transitions where it is easy to see the shift because it is a shift of all cavity data by the same amount.

So how can I isolate that data so I can find the true cavity variation vs the variation from lot to lot.

I take a sliding window and take the running variance as I run through the data. I look for long windows where the variation is as small as possible. I'm going to take this region as reference of where there is no lot shift. There are (presumably) still cavity shifts. I will find the variance of this region: and compare it the variance from the overall dataset.

Image

In this case the lot-to lot variation is not that drastic but you can see in the top right corner it does have some effect: Standard Deviation: 0.00708 vs Standard Deviation: 0.00819

I have now isolated lot variation. If I wanted to at this point I could segregate lots based on quality or shifts to perform DOEs on to see end effects on product quality or other assembly/processes change based on this small input difference.

Having clear delineations in lots is extremely valuable for controlling the process. One of the issues that I face in my job is splicing of stamped reels. This is where different lots are combined together to get a larger final reel to send to us for our processing. This is a double edged sword. I want as large a reel as possible to limit changeover downtime. But because multiple lots are being combined into a single reel I can no longer bin the product based on quality... It makes our setup and changeover of material faster and our process will have less setup variations from this but the underlying material is much less consistent... So that is actually really bad if I want to run tests on the process. Really, what I want is for the previous operation to give us as large of a continuously processed reel as physically possible.

Back to the problem at hand. I've isolated lot variation more or less. And need to assign cavities accurately to see the different shifts of the cavities compared to the variation within the cavity itself.

Waveform Matching

Assigning one cavity correctly at a time has issues because I would just rely on no slip happening and hoping the variations are clear enough that the program can relock onto the right cavity in the cycle. but the medians are close in my data making assignment ambiguous for when a slip does occur. This wont work, the magnitude of the variation is about the same or more than the shift between cavities, I can't distinguish them very well. I know the data is shifted slightly in a repeating pattern, noticeably shifted or it wouldn't have appeared in the FFT.

So lets do this instead: Match the waveform of the sequentially shifted cavity repetition. I'm not trying to assign one value to one cavity anymore, I have a pattern that I can scanning over the data to see where the entire pattern matches. If the pattern gets shifted on the right side of the data I can see the whole sequence gets misaligned. A slip event now shows up as misaligning of way more datapoints which is much easier to see and fix. Example:

For simplification lets assume this sin wave is the cavity shifts. Nice and easy to visualize.

Image

This data is missing a datapoint but I don't know what cavity. It could have slipped by 20 parts it could have slipped by no part and it is just random variation.

Image

But now if I overlay the reference waveform over this new data: I see that everything to the right is shifted off from expected. I can see small shifts now as large deviations from a reference waveform. Hopefully enough so that the program can throw out spots where a slip occurs.

Image

I found that using a single repetition cycle of the data was not good enough. I had to use 2 cycles or 3 cycles of the cavity number in order for this to work. If a slip happens I thow out that section of the data. Cut out that bad data. I'm not overly concerned about throwing out too much data here. I just want accurate cavity categorization with high confidence. Points around slip events can be rejected and I can look at just the clean data without a huge worry to remove to much data. I am working with 100,000 measurements after all.

Cross-Lot Alignment

Now the interesting thing is that that waveform should stay constant between lots... Lots should only shift the whole waveform (at least for most molding). So the same (shifted) waveform appears across all lots. I expect each cavity to be shifted the same amount when relocking alignement between lots.

Now I can sample the variation from each cavity across lots (normalizing by lot variation) so that I get a larger variation datapool of that single cavity.

Image

I just categorized cavity blindly just on AOI data. Cavity was not recorded or reference for this process to work. So now that I have cavities assigned lets look at the median (shift between cavities) and variance given from that cavity.

The mean is depicted as the red dots. for visualization of variance the boxplots are aligned to be the same 0 value.

Image
Image

Now onto the really cool part.

I know the shift of each cavity. I know the variation of each cavity I know the variation for each lot.

I can say what is performing the best and if needed I could tune each one of those cavities in one by one to make them indistinguishable. But lets be real, I am talking about shimming each cavity on the order of 0.005mm to bring the medians in.

Instead what I know about molding is this: In a mold cavity there are pockets where inserts are placed, the inserts have the actual mold features. The features have a certain tolerance to its insert's edge Those pockets location also has an underlying tolerance.

Insert and Pocket Optimization

The mold has a lot of pockets where these inserts go, and the pocket has its own separate variation. when this process was started they are put into the mold in order and sometimes the variation between cavities is constructive (it get misaligned worse) and sometimes it is destructive (the misalignments cancel out).

I can harness these two independent variations to cancel each other out. It is actually the opposite from what you would expect from the assumption that with more cavities there will have more variation. By adding more cavities there are more changes that one of those inserts perfectly cancels out with one of the pockets. You just need to run a few tests where the inserts are rotated to different positions and measuring the end parts on a large enough sample size. Just run each insert on 3 or 4 different positions and I can isolate the shift of a pocket from the shift of the insert.

Image
Image
Image

From the measurement data I can find an optimal combination where the variation between each cavity cancels mold pocket variation. So in essence, One cavity has the best variation, but going to 2 or 3 cavities is where the worst variation would be. If you are running a 16 or... a 64 cavity mold? you're golden. It just takes a little bit of data and analysis and you can have variations as small as your one cavity mold (roughly)

And I'm not entirely sure about this claim... but I think your alignment will be comparable or better from this process than even if you did an extremely high resolution scan of each pocket and cavity and compared it to each other and true position of features between each other. By measuring the end product, the functional good and using statistical averaging to find true values, I can get a very accurate shift measurement. Not to mention the stamping process that would be fed into this that has the actual progression on it. You would have to measure the true position of each stamping etc etc etc then compensate at the cavity blah blah blah. No-one is going to go to that effort (if they even had the measurement equipment) to align a mold to the stamping progression that precisely. But if I am measuring final goods? No problem.

If you do this process on overmolded stamped components you can reduce your variation by 30-50% Going from a variation of .014mm and drop it down to .007mm. That is crazy.

Once incoming goods are indistinguishable statistically it makes seeing the next processes variation much clearer, and the process after that... on and on.

You can see my terrible youtube video on the subject here:

Loading video…